
Sparklines: Handle With Care
Dan Russell from the Creating Passionate Users blog got me hooked on Juice Analytics after he noticed me blogging a bit about visualizing the passage of time using Microsoft Office software, and about his "dot-plot" exercise in particular. Since then I've kept up with their blog, and some of their public-oriented posts about analytics play very well in Peoria, by which I mean they are intelligible and useful to people like myself who are more or less brine shrimp when it comes to statistical analysis.
So I've been reading the JA blog for a while, and they've been talking a lot lately about their hiring practices and management philosophy, and, fickle blog-reader that I am, I was starting to wonder if this really was a feed to grow fat on. Then they posted a nice little visualization in Excel that made me very happy.
If you've spent any time writing Excel formulas, this should make immediate sense:
If the way they wrote this formula doesn't immediately strike you, head over to their blog and let them walk you through it - it's extremely simple and this technique has many fabulous applications. Most importantly, it does exactly what a visualization embedded in a data table should do: It makes the data easier to understand than text alone.
This is a loose application of the concept of "Sparklines" developed by information designer Edward Tufte. These "mini-charts" - "intense, simple, word-sized graphics," as Tufte describes them - offer tiny snapshots of graphical data that look like they should be cut out and pasted to the wall of a dollhouse home office. While they have many useful applications which allow for quick comparisons and for the insertion of chartlike objects into tabular data and even into blocks of text - even statistical analysis has its faddish behavior. Since many have sung their praises and some now seem eager to apply Sparklines to every imaginable dataset, I'd like to offer some observations to accompany Tufte's own suggestions regarding the care and feeding of Sparklines.
1. Sparklines often suffer from isolation. Single charts, or groupings of charts which (a) measure different things and (b) use different scales, lose considerable value without x- and y-axis values. Information Aesthetics should certainly be excused for using these - - and there is a tiny thrill at seeing so much data compressed so tightly. But without a scale to hang your hat on, there's little of real value here. The unique visitor graph is meaningless without an x-axis (the date) which would allow for some interpretation of what new content readers found interesting, and without a y-axis ($ values) the advertising revenue chart is meaningless as well (assuming I cared about this in the first place). At least with the word count chart I can see what days the bloggers take off, and I could see further utility in offering paired metrics of word count and the number of posts per day; this would tell you, at a glance, the depth of content on the blog and thus whether it was more concerned with sharing links to other sources or offering its own analysis, or, to put it differently, whether it took on the role of a hub or a spoke. As they stand, however, these Sparklines, with the exception of the OS indicator, are the statistical equivalent of Pop Rocks.
2. Some audiences demand more complexity. Fans of Tufte should know this well from his critiques of PowerPoint, which he argues is not a design space suitable for representing any serious data; his critique centers on how much information is lost in translation as business and scientific reports move from paper formats to PowerPoint slides. Sparklines come with related baggage - they strip data of much of its detail, and this tradeoff must be acknowledged and the cost-benefit ratio assessed. Juice Analytics posted a sample Sparkline application back in January that was highly illuminating to me, although not in the way the author intended. Titled "Restoring Romance to the Sports Page," a Sparkline enthusiast saw a self-evident case that turning this
 into this
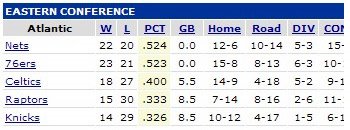
 would be a boon for sports fans. Anyone can see that here Sparklines offer great visual depth at a very low mental processing cost - it's a great way to compare team records in a qualitative way, and even offers chronological data that a win-loss record does not, identifying good and bad streaks over the course of a season. More generally, the attempt is interesting because it reminds us of how much chronology is lost, and how useful that timeline is, when discussing aggregate statistical data for players, teams, and leagues over the course of a season. But the data offered in the simple table is not being respected by this suggested change, and I suspect serious fans - by which I mean people who regularly study the statistics provided in newspapers - would be dissatisfied with the change, and not merely on the grounds of tradition.
I'm not much of a sports nut, but I've known enough of them to know that they have a couple of needs that this sparkline fails to satisfy. I also believe there are many audiences for which similar or additional criteria are poorly served through the use of Sparklines.
First, they do independent analysis, based on their own criteria, using the statistical data. Stripping out the home/road rankings takes an explicit side against the psychological analysis fans regularly engage in; using Sparkines, one source of the Celtics' biggest problems in the sample season above becomes invisible. As a longtime San Antonio Spurs fan, I can attest to the "romance" of a team's divergent win-loss records on and off the home court; it offers solace when a team is down, has predictive power when a team is up, and even, at least in terms of "romance," is a major player in the anticipated, if not real, outcomes of national titles, where a series of seven games comes down with statistical certainty in favor of one team or another based on the complex and highly individualized metric developed by every fan, and of which the home/road records are at a variable of variable importance. {Addendum: Chris Gemignani wrote in from Juice Analytics to point out that their Sparklines example also failed sports fans in its disregarding of relative team standings. Good point, Chris!}
Second, the method by which they communicate this information is verbal, not visual. Numbers can be easily verbalized by humans, while Sparklines would require beat-based or musical interpretation. As much as I'd like to see tailgaters comparing opposing teams' records using an elaborate system of chest thumps or boardroom executives singing lilting arias to each other in the elevator to review stock prices, in terms of practicality, numbers win. In some cases, the best application of Sparklines is in supplementing, not replacing, other means.
None of this is intended to suggest that Sparklines are not useful; indeed, their overextension may be the natural result of the obvious, instinctual, and dramatic utility that accompanies truly innovative ideas. But I do believe that when the dust settles from this discovery, they will be implemented with greater care.
That being said, there are a couple of great resources now that can help you produce your own Sparklines. Bissantz has developed a custom bar-graph font and MS Office Add-In that can generate Sparklines from statistical data, and LodgePhoto has written a script that can create Sparklines in Photoshop from data stored in text files; I'll be playing with both of these as I attempt to make sense of the results of a survey I am conducting of blogs hosted on Blogger.
If anyone else has seen additional critiques of the limitations of Sparklines, I'd love to see them - I found nothing to moderate their well-deserved praise. I may amend and add to this post as I or others develop additional points of critique, but I will always give credit.
![]()


3 comments:
Jeremiah,
A great question tactfully raised. Any approach, technique, or technology is good on certain problem domains and bad on others. Commercial vendors and sellers of BI tools would like you to believe their product works great in all cases all the time.
Sparklines are strong when you have large numbers of similar series, when trends matter more than exact values. I think the real weakness of the simple NBA sparklines we built is not that they don't display home/away info (that could be added to the sparkline), but rather that relative rankings are extremely important to sports fans. Are the Nets one or two games ahead of the Sixers? Can't tell, but it matters A LOT to fans.
Thanks,
Chris Gemignani
Good observation, Chris. I will nest this into the critique, with credit.
I'm glad you found my patently amateur perspective interesting. I'm a big fan of your work and look forward to many more Juice Analytics forays into hands-on analytics.
It seems that what you are getting at, and a lot of the posts on JuiceA point to is that Sparklines are a handy compliment to numerical data. They allow one to quickly scan using visual cues the data that looks interesting and delve deeper into the details after they've found what they're looking for; the NBA example, I agree is not that good on it's own - but paired with the typical stats, gives a walth more info (chrono and streak) in a compressed format
Post a Comment