
Two New Views On Digital Photographs
Things are getting very interesting over at oughtful these days. Poet, photographer, designer and programmer Matthew Hollett recently posted two visual experiments in which he atttempts to "'translate' digital photographic data into other systems."
The first is his "index of first lines," which stacks the first row of pixels from each digital photo he took over two months in 2004. The resulting image, generated by a hand-rolled PHP script, reminds me of tree rings and geological strata. Since the 1,000 included images span only two months (another byproduct of our digital age) there are areas of banding throughout which Hollett can tie to specific events and locations.
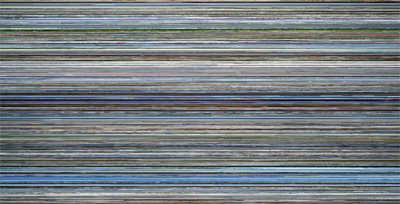 index of first lines
Of the project, Hollett writes:
While it's impossible for me to identify individual photos, looking at this image does bring back memories. Its hazy horizontal sweep evokes a landscape seen from the window of a moving train, a suitable metaphor for the fleeting, mesmerizing summer I remember. The 'busiest' areas (with the most contrasting lines) represent hectic days wandering London or Paris, when no two photos were alike. Thicker bands of colour indicate slower times, when I snapped many photos with similar scenery - the greenery of The Gibberd Garden, or a clear blue sky over Brighton Pier. A certain band of white a third of the way down - near the end of the first month - is a trace of the overcast sky on the afternoon I first visited Stonehenge. In this way, index of first lines is an accurate cross-section of my memory, or at least my photographic habits. I read it in the same way I occasionally reread the journals I kept during that summer's travels: not top-to-bottom, but discursively, letting my eyes and mind wander. Nevertheless, examining it is an act of reading.
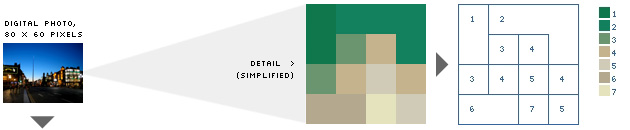
Hollett's second project, posted yesterday, is a "paint-by-number" chart which codes every pixel in a digital image with a number to create a black-and-white grid that could be filled in from a printout. Visit oughtful to see a resampled view of a full image rendered in this way.
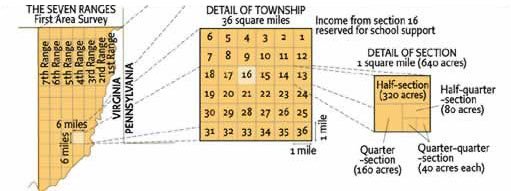
Taken on its own, the paint-by-number experiment feels as unnatural as the "index" feels natural. While Hollett's first-line experiment suggests life, or perhaps its decay and calcification - a historical record generated according to a set of rules (written in PHP!) which operate silently and unthinkingly to produce their result - we are here faced with an image that has been denuded of its richness, its color stripped out in favor of a hungry, anticipatory indexing, like a map of new territory apportioned out for eager colonists without regard to topology or ecological biome. Here the information is not ignored; it is all there, just translated into a format that is not visually accessible. But like real and metaphorical geography (the image above is a detail of a small portion of Ohio's share of the Northwest Ordinance), the whole cannot be read intelligibly in fragments without sacrificing the collective forms that give meaning to the whole.
![]()


No comments:
Post a Comment